Friday, April 28, 2006

Exchange rate regimes in selected Transition Economies

Today not many comments, but just some facts about exchange rate regimes in selected transition economies. A more extensive comment should arrive at some point.
Generally, the TEs embarked on a whole variety of routes in terms of exchange rate regimes – from full floats to currency boards. Moreover, as some maintained the same regime since early 1990s, some went through gradual regime changes, and finally others experimented or where forced to abandon regimes. The question on the optimality of the paths, remains open.

Hungary

Figure 1. HUF exchange rates against EUR (blue) and USD (red). Vertical lines indicate dates described below with (*) . Dates: June 1991-April 2006.
- 9 Dec 1991 - peg to basket 50%ECU, 50% USD, C.B. intervention band +/-0.3%;
- 2 Aug 1993 – basket changed to 50%DEM, 50% USD;
- 16 May 1994 - basket changed to 70%ECU, 30% USD;
- 22 Dec 1994 - intervention band widened to +/-2.25%;
- 13 Mar 1995 – (*) crawling peg/band to basket. Bands at +/-2.25%. Crawl rate decreasing;
- 1 Jan 1997 – basket changed to 70%DEM, 30% USD;
- 1 Jan 1999 – basket changed to 70%EUR, 30% USD;
- 1 Jan 2000 – basket changed to 100% EUR;
- 3 May 2001(*) – band widened to +/-15%;
- 1 Oct 2001(*) – fixed horizontal band +/-15%.
Notes: Devaluations in early 1990s. (*) vertical line on graph. Source: Aglietta, Baulant, Moatti
Czech Republic
Figure 2. CZK exchange rates against EUR (blue) and USD (red). Vertical lines indicate dates described below with (*) . Dates: December 1991-April 2006.
- 1 Jan 1991 – fixed peg against basket 65% DEM, 35% USD. C.B. intervention band +/-0.5%;
- 28 Feb 1996(*) – band widened to +/-7.5%;
- 26 Mar 1997(*) – (managed) float;
Note: (*) vertical line on graph. Source: ABM, IMF
Slovakia

Figure 3. SKK exchange rates against EUR (blue) and USD (red). Vertical lines indicate dates described below with (*) . Dates: July 1993-April 2006.
- 1 Jan 1991 – fixed peg against basket 60% DEM, 40% USD, C.B. intervention band +/-1.5%;
- 1 Jan 1996 – band widened to +/-3%;
- 16 Jul 1996 – band widened to +/-5%;
- 1 Jan 1997 – band widened to +/-7%;
- 1 Oct 1998(*) – managed float;
- 25 Nov 2005(*) - ERM II;
Note: (*) vertical line on graph. Source: ABM, IMF
Poland

Figure 4. PLN exchange rates against EUR (blue) and USD (red). Vertical lines indicate dates described below with (*) . Dates: December 1991-April 2006.
- 1 Jan 1990 – fixed to USD;
- 16 May 1991 – fixed to basket (45% USD, 55% DEM+GBP+FF+CHF);
- 14 Oct 1991 – crawling peg to (same) basket. Crawl rate decreasing, C.B. intervention margin +/-0.5%;
- 6 Mar 1995 – C.B. intervention margin widened to +/-2.0%;
- 16 May 1995 – crawling band (to basket) +/-7%. Crawl rate decreasing;
- 26 Feb 1998 – band widened to +/-10%;
- 28 Oct 1998 – band widened to +/-12.5%;
- 1 Jan 1999 – basket changed to 55% EUR, 45% USD;
- 25 Mar 1999 – band widened to +/-15%;
- 12 Apr 2000(*) – free float (but C.B. reserves extraordinary right to intervene)
Notes: Devaluations in early 1990s. (*) vertical line on graph. Source: Kokoszczynski, ABM, NBP

Slovenia Figure 5. SIT exchange rates against EUR (blue) and USD (red). Vertical lines indicate dates described below with (*) . Dates: October 1991-April 2006.
- 8 Oct 1991 – managed float;
- 27 Jun 2004 – ERM II;
Source: IMF, BSI;
Estonia
- 20 Jun 1992 – currency board with DEM (subsequently EUR);
- 27 Jun 2004 – ERM II;
Source: IMF, Eesti Pank;
Latvia
- 20 Jul 1992 – managed float;
- 12 Feb 1994 – fixed peg to SDR basket. C.B. margin +/-1%;
- 1 Jan 2005 – fixed peg to EUR. C.B. margin +/-1%;
- 2 May 2005 – ERM II;
Source: IMF, Bank of Latvia, Eesti Pank, Hansabank;
Lithuania Figure 6. LTL exchange rates against EUR (blue) and USD (red). Vertical lines indicate dates described below with (*) . Dates: July 1993-April 2006.
- 1 Jul 1992 – managed float;
- 1 Apr 1994(*) – currency board with USD;
- 2 Feb 2002(*) – currency board with EUR;
- 27 Jun 2004 – ERM II;
Note: (*) vertical line on graph. Source: Bank of Lithuania, IMF
Romania
- Aug 1992 – managed float, various degree of tightness;
Note: Due to heavy interventions, especially in 2001, IMF classifies Romanian regime as a (de facto) crawling peg/crawling band to USD(2001-Mar 2003) and EUR (3 Mar 2003 - 2 Nov 2004), afterwards the managed float is in place.
Sources: IMF, Kocenda, NBRo, EC.
Bulgaria
- Feb 1991 – managed float;
- 1 Jul 1997 – currency board with DEM (subsequently EUR);
Source: BNB, Kocenda

Others :
Moldova - independent float since early 1990s, managed float since 30 June 2002 (IMF);
Georgia – managed float since early 1990s, 7 Dec 1998 ceased to intervene thus labeled as independent float, due to nature of interventions 1 Jan 2003 again labeled managed float (IMF); Russia – early 1990s managed float, mid 1995 band to USD (initially ca. +/-13%), September 1998 ceased intervention and switched to managed float (IMF);
Ukraine – de facto currency peg to USD since late 1990s (CASE);
Croatia –managed float since early 1990s (IMF);
Albania - generally a float with occasional interventions to reduce volatility since early 1990s (IMF);
Data Source for graphs – DataStream.
Friday, April 21, 2006

Hungary – heading for trouble?

A recent declaration from the governor of the National Bank of Hungary (NBH) on the forint being in “serious danger”(FT 20/04/2006) initiated some discussion on the situation in the Central European state. Although the timing of the statement sparked accusations of political interference of the governor, yet is hard to contest its sheer content. Additionally, The Economist of April 15th (“Lynx economies”) summarizes a report by WIIW which praises the performance of the CEE NMS but cautions that “Hungary with its big current-account and budget deficits looks vulnerable”. Voices on Hungary’s exposure have been louder recently and the country has been given a closer look after the deterioration of the situation in Iceland where the krona plummeted by over 25% (against the EUR) in the last 2 months. The similarity of the situations the two countries should not be overestimated.

Overall the Hungarian economy, despite having one of the lower growth rates among the CEE NMS, is still expanding at a rate above 4%. Inflation has been brought down to a low of 2.3%, Short and long term interest rates, despite a recent surge, are at an acceptable, though relatively high, in comparison with other CEECs, level. During the last 12 months the forint has depreciated against the USD by 14%, EUR 7.3% (of which 5 % points in the last two months). This does not seem alarming, but certainly distinguishes Hungary from Poland, Czech Republic and Slovakia whos’ currencies moved in a similar magnitude but in the opposite direction.
On the other hand with a current account deficit of around 8% of GDP (IMF), by far the highest and most persistent among the big NMS (but still smaller than that of the Baltics), the imbalances and thus vulnerabilities are significant.
Moreover it is Hungary who has by far the highest public debt of all the CEE NMS, standing close to the Maastricht 60% of GDP reference value, sees the government spending much more than collecting thus looking towards further borrowing. The fiscal deficit has been over 8% GDP in the past years and the budget target at 6.6% this year, already a hefty sum, was exceeded in the first quarter of 2006, with estimates of a possible blow-up again to the vicinity of 8% by the end of the year. Lending is increasing, but there does not seem a credit boom, at least not of the pace of the one in the Baltic States.

Elections have a lot to do with the persistance of the situation, and they certainly contributed to the government sticking to its spending spree. The outcome can be expected to follow one of at least two basic scenarios.
On one hand, perhaps not seeming an obvious outcome of the April elections, a strong government with political will to push reforms and reduce spending could turn the situation around.
On the other however, if the newly elected government lacks will or political power to reform public finances, especially to push through cuts in spending - the country could face problems. If the election results in an unstable government, and prospects of a close upcoming election rerun, this would possibly inflate the deficit even more, through populist pre-campaign maneuvers and put pressure on the interest and exchange rates, raising the question how would the financial markets react?
Hungary had already postponed its euro adoption target date from 2008 to 2010, and there are even talks of shifting it past 2011 or even 2013 which are reflected in Reuters polls( see article by T.Fisher and D. Freeman) and estimates of the perception of the financial markets expectations (see interesting paper from the NBH ). Overall, a strong depreciation of the forint and a following interest rate hike could push the Magyar economy into crisis. Moreover if the new parliament is not dismissed ahead of schedule, 2010 will be the next election year. Thus if the new entry date will be set 2011/2012 in the next election campaign the euro may be at play.
Both major parties competing in the election campaign seem to agree on the reform of public finances and the need to curb fiscal deficit, but at the same time promise tax cuts and pension and other expenditure increases. How much of the latter is campaign rhetoric may be crucial…

Data: Eurostat, NBH, IMF Country reports, The Economist, FT.

Friday, April 07, 2006

Will labor migration cause the speeding up of social security reforms?

The hot debate on opening up of labor markets of “old” EU states has much more angles than in traditionally perceived. Feared by the West and most desired by the East, it seems to be of important magnitude: in the UK, there are 350 thousand legal workers from the NMS, ( Commission Report ) of which most relatively young (80% under the age of 34, 44% under the age of 24), with another 100 thousand in Ireland.
This migration, seen sometimes as a solution to many of the CEECs economic woes, is often being implicitly encouraged as contributing to the reduction of unemployment. But it may just turn out that it will create more troubles than it will bring gains – unless crucial reforms are sped up in Central and Eastern Europe.

The picture is not as beautiful as often painted – there are quite a few arguments that should lead analysts to give a closer look at the structure of this migration.
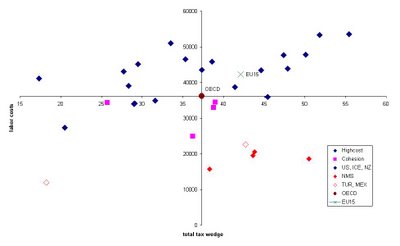
First of all, it is important who leaves. As most of the CEECs have at least partial pay-as-you-go retirement schemes, the question whether the people that do leave would be able to get a job at home may be quite important. If it is an unemployed, who receives benefit and has little prospect of finding a job at home that goes this should reduce the burden on the ones that stay. But if it is young people, people working, or potentially able to find a job in the near future that leave – this may at a point pose a threat to the sustainability of the social security systems and especially pension schemes. The outflow of (potential contributors) reduces the revenue of social security schemes – at the same time leading to an increase in the burden on the workers that remain in the country. And this burden is already relatively high, compared to total labor costs (see Figure 1).
Second, it matters in what character these people go – if the migration is temporary, but workers come back to set up there own businesses once they gather some capital – this may eventually reduce the pressures. But if they stay abroad, they will contribute to the pension schemes in there new home countries instead of the NMS, while even without taking this migration into account dependency ratios in CEECs are expected to increase substantially in the next years. Thus the burden on the ones that remain should increase even further.
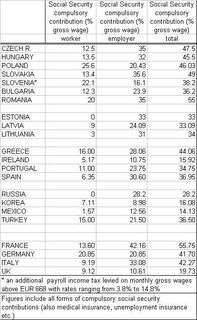
In Table 1 we have the average income workers’ social security burdens. The figures, especially for the larger CEECs, are comparable to the highest EU numbers, while being relatively high compared to other emerging market countries and even the ‘cohesion’ group of EU members (Greece, Ireland, Portugal and Spain). In the former comparison, demographics may be claimed to help explain some of the difference, the demographic structure and forecasts for CEECs and cohesion states are not much different.


Figure 1: Tax wedge and total labor costs (source: OECD). New Member States (Czech Republic, Hungary, Poland and Slovakia) in red, Cohesion States in pink, developed countries in dark blue.


Table 1: Compulsory social security contributions as % of gross salary.The data is for 2005, in percentage of gross salary of a person earning 100% of the average wage. The figures are not directly comparable, as include country specific taxes, but are useful to give a picture of the burden that is borne by average workers. Source: World Bank, National Ministries' websites, www.worldwide-tax.com, Social Security Agency, OECD.


Thus if it is not (just) the demographics, then quite probably the inefficient social security systems have a strong say – fifteen years after the start of transition, despite various reform attempts, most countries have still an over-blown, and relatively costly system, inherited from the previous regime and difficult to reform because of strong interests groups.
Economists do not provide much of an argument that PAYG systems should be inferior to savings systems, and in fact with some conditions fulfilled these can be equivalent. And despite most schemes are at least intended to be self-financing it is usually up to the government to finance any deficits – but this is just another cost a taxpayer must bear.
As said, reforms are being introduced, though usually at a gradual pace, but this may prove just too slow. They include raising the retirement age, especially for women, switching away from the PAYG to two or three pillar schemes and reducing possibilities of early retirement. Yet strong groups of interests together with political populism often impede more ambitious attempts – just for example in Poland – some of the reform plans were watered down due to protests of interest groups (miners, which were given special concessions) before the last elections.

Therefore, with ‘unfavorable’ demographics and still inefficient social security systems it may just be that workers migration to the old-EU will inevitably force the reforms to speed up.