Real GDP growth in CEECs
Again, just some data and graphs - comments and a discussion should follow at some point.

Figure 1. Developments in yearly real GDP, (1989=100), 1989-2005.
Source: Groningen Growth and Development Centre . Note: colors represent from top to bottom(according to 2005 value): Green - old EU (Spain, UK, France, Germany, Italy), yellow - CEEC-5 (Poland, Slovakia, Slovenia, Hungary, Czech R.), red - Baltics (Estonia, Latvia, Lithuania), blue - candidates (Romania, Croatia, Bulgaria).
Generally, the CEEC experienced a major slump in GDP at the beginning of the transition in the early 1990s, which was subsequently followed by a rebound, but for some of the countries returning to official pre-1990 levels of real GDP took more than a decade.
Noticeably, the Baltics experienced the largest declines. Real GDP fell by a third to almost a half - starting in 1991, before the countries proclaimed their independence - and continuing to fall till 1994 (Latvia and Lithuania) and 1993 (Estonia) - which roughly coincides with the times of fixing the currencies in these countries. Ever since the recovery in the Baltics is on track, although in the former two, the pre-1990 levels were reached just recently.
On the other hand, in Poland, where the fall was relatively small, and short-lasting, and the recovery could be felt already in 1992, while 1989 levels where exceeded in 1995. This is the reason why the Polish economy, despite a slowdown in the early 2000s and recently slower (relative to other CEEC NMS) growth, still remains the one with the largest cumulative growth since pre-transition times.
The Czech and Slovak Republics recovered relatively quickly, already in 1993 - the year of the "divorce" - both countries started growing. The Hungarian experience was similar, however out of these three countries, the return to pre-1990 levels occurred in the late 1990s in Slovakia, while the Czech Republic, where the initial slump was relatively modest, underwent a crisis in 1997 and retained its pre-1990 real GDP levels a couple years later.
Slovenia, underwent a short slump in 1991-1992 but recovered subsequently, superseding pre-transition levels in late 1990s.
For a comparison, the graph includes EU 4 biggest members, who grew by 20% (Italy) to 60%(Spain) during the examined period, the current candidate countries, Romania and Bulgaria, the slump was longer lasting, and growth picked-up later. Both are now near to official 1989 levels.
Now, for the growth of per capita GDP in the last decade, we refer to Figure 2.
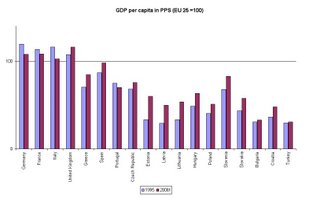
Figure 2. Real GDP (PPS) per capita relative to EU-25 (1995 and 2006, forecast).
From left to right: Germany, France, Italy, UK, Greece, Spain, Portugal, Czech R., Estonia, Latvia, Lithuania, Hungary, Poland, Slovakia, Slovenia, Bulgaria, Croatia, Turkey.
Source: Eurostat
Slovenia and the Czech Republic have levels of GDP per capita similar to the ‘Cohesion States’, actually slightly higher than those of Portugal. Poland despite its early transition recovery remains among the poorest EU states, together with the Baltics, which however, have saw the biggest rises during the past decade. Hungary and Slovakia have also grown relative to the EU average, and are currently at close to 60% of the EU average GDP per capita.
posted by tomasz kozluk @ 5:50 PM
1 comments
![]()
![]()

1 Comments:
hej,
I'm writing my diploma thesis in the field of the CEECs. and I really like the graph on your comment on the transition countries. would it be possible to get that graph in big?
Sincerely,
A. M. (Adelheid.Mayr@student.uibk.ac.at)
Post a Comment
<< Home